An Elevated Body Mass Index is Associated with Lower Serum Adalimumab Levels without Clinical Significance
ADVANCED RESEARCH IN GASTROENTEROLOGY & HEPATOLOGY JUNIPER PUBLISHERS
Abstract
Background: Biologics, specifically anti-TNF agents, have been an integral part of our treatment paradigm for IBD for several years. However, therapeutic drug monitoring (TDM) enhances our ability to optimize dosing regimens. Studies have shown that trough levels<4.9ug/mL are associated with loss of response to adalimumab (ADA). An increased body weight may change the pharmacokinetics of adalimumab in IBD. The primary aim of this study was to evaluate the impact of body mass index (BMI) on adalimumab drug levels in IBD patients, as well as its potential clinical implications.
Methods:A database was compiled via retrospective chart review of 507 IBD patients seen at our Digestive Disease Center (DDC) between July 2013 and March 2016. Variables in the database include patient’s weight, medications, serum adalimumab levels, dates of medication administration, endoscopic findings, fecal calprotectin, erythrocyte sedimentation rate, and C-reactive protein.
Results: Using ANOVA to compare the two groups, there was a significant association with lower ADA levels in patient with BMI >30kg/m2 when compared to those with BMI <30kg/m2 (p = 0.009). Average adalimumab levels in these two groups were 11.8ug/mL and 8.8ug/mL, respectively. Within these groups, there was no statistically significant difference in severity of endoscopic findings. Furthermore, there was no statistically significant difference in serum inflammatory markers between groups.
Conclusion: In a cohort of patients with inflammatory bowel disease, despite a downward trend in serum adalimumab levels as weight increased, there did not seem to be any apparent clinical significance to these findings. They neither correlated to severity of endoscopic findings, or to elevations in serum inflammatory markers. 57% of the total sample size was either overweight or obese, which we feel accurately reflects the phenotypic breakdown of the overall IBD population, as well as that of the general population. More studies are needed to follow the long-term progression of these lower adalimumab levels to determine if this leads to increased antidrug antibody formation and/or loss of response over time.
Keywords: Serum; Inflammatory markers; Phenotypic breakdown; Adalimumab levels; Antibody formation; Crohn’s disease; Obesity
Abbrevations: CDAI: Crohn’s Disease Activity Index; SES-CD: Endoscopy Score for Crohn’s Disease; ESR: Erythrocyte Sedimentation Rate; CRP: C-Reactive Protein; DDC: Digestive Disease Center; BMI: Body Mass Index; TNF-Alpha: Tumor Necrosis Factor-Alpha; TDM: Therapeutic Drug Monitoring; IBD: Inflammatory Bowel Disease
Introduction
Inflammatory Bowel Disease (IBD), comprised of Crohn’s disease and ulcerative colitis, are chronic inflammatory conditions that affect the GI tract. The prevalence of IBD is increasing throughout the world, becoming a substantial global public health concern [1]. Obesity, also considered to be a chronic inflammatory condition contributing to millions of deaths annually, has also seen an increase in prevalence over the past few decades. In 2008, the World Health Organization estimated 35% of adults worldwide to be overweight. This represented a 60% increase from prevalence in 1980 [2]. North and South America have a particularly high prevalence of overweight and obese population, with 36.5% of their respective populations falling under one of these two categories for the year 2018. Furthermore, this increased prevalence is also seen in youth [3].
Biologics have been an integral part of our treatment paradigm for IBD for several years, and advances in therapeutic drug monitoring (TDM) enhance our ability to optimize treatment [4]. TDM allows for serum trough levels and antidrug antibody concentrations of biologic agents to be measured. Serum concentration can be correlated clinically by physicians, and used to adjust dosing, or switch to different treatment modalities, but an absolute cutoff for recommended trough levels has not been set by guidelines [5]. A median adalimumab trough level of 4.8ug/ mL to correlate with loss of response has been suggested in the past [6] and additionally, the formation of antibodies against adalimumab has been shown to correlate with a loss of response, with low adalimumab trough levels as a possible predisposing factor to antidrug antibody formation [7].
Tumor necrosis factor-alpha (TNF-alpha) agents block interaction with the p55 and p75 cell surface TNF receptors [8]. Traditionally, after an initial loading dose, the dose of adalimumab is 40mg every 14 days, regardless of body mass index (BMI). However, elevated BMI has been shown to be associated with a shorter time to dose escalation [9]. Although adalimumab is not lipophilic [8], increased (BMI) may result in increased volumes of distribution, which may correlate with a trend towards lower serum values of adalimumab [10]. The significance of lower adalimumab trough levels within the obese population is unknown, but decreased drug efficacy as well as a higher propensity to develop antidrug antibodies were concerns we sought to explore within our IBD population. The primary aim of this study is to assess the correlation between BMI and adalimumab drug levels in IBD patients, and to determine any potential clinical implications in this patient population.
Methods
Patients
An IRB approved database consisting of all inflammatory bowel disease patients at the Medical University of South Carolina (MUSC) was created through the EPIC system and updated in real time. Within this database, 507 patients were identified retrospectively with a history of adalimumab use. All patients had been seen at our Digestive Disease Center (DDC) between July 2013 and March 2016 and had an ICD-9 diagnosis of either Crohn’s disease or ulcerative colitis. Of these patients, 296 were female and 211 were male. 395 had a diagnosis of CD and 112 had a diagnosis of UC.


Variables in the database include patient’s weight, height, medication dosing, serum adalimumab levels, dates of medication administration, and endoscopic findings. Patients were then broken down by three separate BMI subcategories: BMI <25 (underweight or normal weight), BMI 25-30 (overweight), and BMI >30 (obese) [11]. Additionally, a separate comparison between non-obese (BMI< 30) and obese (BMI>30) was made. All Class A tables compare the BMI classes with the BMI <25, BMI 25- 30, and BMI >30 groups; Class B tables compare the BMI <30 and >30 groups (Tables 1a&b).
Materials
Given this was a retrospective analysis on an IRB approved database, there was no additional information or data required from individual patients. All data was obtained through the EPIC electronic health records system used at MUSC. Within the EPIC system, data included baseline characteristics such as gender, age, diagnosis (i.e. Crohn’s disease or ulcerative colitis), weight, and BMI. Results were based both on lab findings, as well as endoscopic findings reported on each segment of the bowel visualized during a prior colonoscopy. In the instance of a report lacking sufficient detail, images in the electronic medical record were reviewed and reassessed to determine severity of disease.
Once a correlation between BMI and serum trough levels was established, patient charts were reopened to assess whether lower trough levels correlated to a worse clinical outcome with regards to disease severity. Given the subjective nature of using patient scoring systems for symptoms, such as the Crohn’s Disease Activity Index (CDAI), investigators aimed to use an objective measurement of disease severity. Thus, a classification system was developed distinguishing normal, mild, moderate, or severe disease for both Crohn’s disease and ulcerative colitis. These criteria were created using the Simplified Endoscopy Score for Crohn’s disease (SES-CD) [12], and the Mayo Clinic classification system for ulcerative colitis [13]. For patients with ulcerative colitis
For patients with ulcerative colitis, the Mayo scoring system was used, with a score of 0-3; 0 for no disease, 1 for mild disease, 2 for moderate disease, or 3 for severe disease.
For patients with Crohn’s disease, the simple endoscopy score for Crohn’s disease (SES-CD) was used, with the score based on 4 variables (size of ulcers, percent of surface ulcerated, percent of colon segment affected and presence of narrowing), while evaluating 5 bowel segments (rectum, sigmoid colon, descending colon, transverse colon, ascending colon and ileum) [14]. Each variable of each segment of the colon was graded from 0-3, making the scoring system 0-56 [15].
In terms of lab values, we used the most recent entries in patients with adalimumab use in their history, and included fecal calprotectin, erythrocyte sedimentation rate (ESR), and C-reactive protein (CRP). Adalimumab trough levels were collected through EPIC and compared to the above variables. The trough levels were collected, and run through different sources, including Prometheus and LabCorp, two private diagnostic laboratory companies.
Statistical analyses were run using the R open source programming language [16], including a multivariate analysis using Pearson’s chi-squared test, summary statistics, counts, and means/averages. Data from the IBD database was analyzed by a private statistician. ANOVA was first used to compare the two groups of BMI <30 and BMI >30, and then subsequently, a multivariate analysis was done breaking down BMI into <25kg/ m2, 25-30kg/m2, and >30 kg/m2 Means and medians were used to describe quantitative variables, while proportions were reported in percentages. A p-value of 0.05 was used to determine statistical significance.
Result
Patients and data collection
Baseline characteristics
A total of 507 patients were included in the study and consisted of individuals with a diagnosis of either ulcerative colitis or Crohn’s disease, combined with a history of adalimumab use. 296 were female and 211 were male, and the average age was 40.8. 395 had a diagnosis of CD, while 112 had a diagnosis of UC.
The BMI counts are outlined in Table 1. There were 11 patients who did not have a documented BMI and therefore were not included. Based on results, 281 patients in the study (56.6%) were overweight or obese.
42 out of 135 patients (31.1%) with BMI > 30 kg/m2 had serum adalimumab levels drawn, while 44 out of 136 patients (30.1%) with BMI 25-30 30kg/m2 had adalimumab levels drawn; 54 out of 215 patients (25.1%) with BMI <25 had adalimumab levels drawn. 385 of 507 patients (75.9%) were currently on adalimumab at the conclusion of the study.
Endoscopic findings
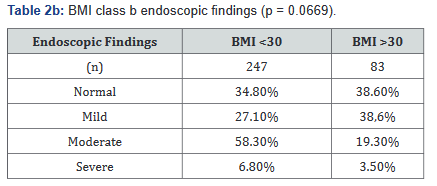
Two separate analyses were done within different BMI distributions, and compared with disease severity endoscopically. Tables 2a&b illustrates the number of patients in each BMI subgroup who were found to have one of the four designated endoscopic classifications, and although Tables 2a&b show a trend towards statistical significance for an association with a lower BMI with more severe disease, neither demonstrate statistical significance.

Tables 3a&b controls endoscopic disease severity by BMI for gender and does not show any statistically significant difference in endoscopic disease severity between males and females.


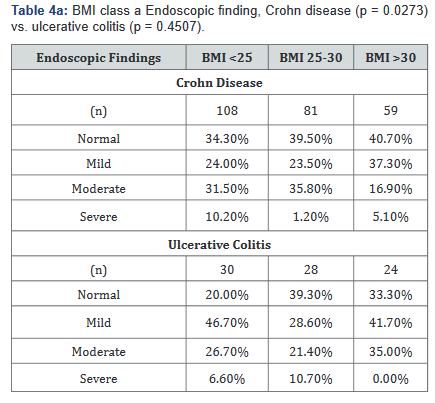
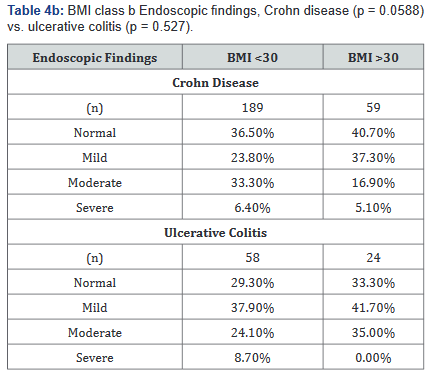
Tables 4a&b compared differences in the severity of endoscopic findings across BMI ranges in both Crohn’s disease and Ulcerative colitis. Table 4a illustrates that the severity of endoscopic findings may be inversely related to BMI in Crohn’s disease (p=0.027), but not in ulcerative colitis (p=0.45). Table 4b shows a possible trend towards statistical significance in Crohn’s disease (p=0.059), but not in ulcerative colitis (p=0.53).
Antifungal resistance
Fecal calprotectin, C-reactive protein (CRP), and erythrocyte sedimentation rate (ESR) were compared with BMI populations in order to investigate possible correlation between lower serum adalimumab level and abnormal lab values. Fecal calprotectin was checked in 137 of the 507 patients (27%) included in the study. Analyses compared Crohn’s disease to ulcerative colitis populations, as well as males to females.
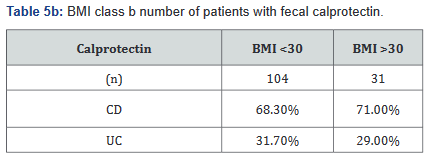
Tables 5a&b reveals the total number of patients, as well as the number with Crohn’s disease and ulcerative colitis in Groups A and B. Tables 6a&b outlines the level of fecal calprotectin, again outlined based on disease state, and subsequently separated into BMI Groups A and B.



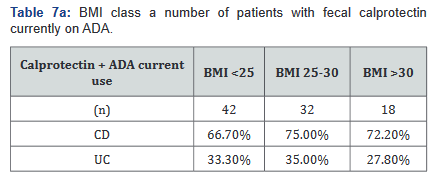
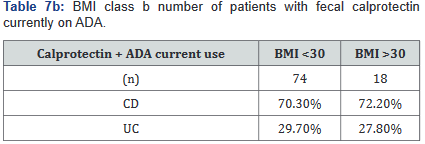
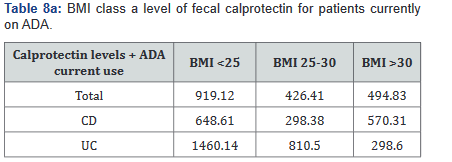
After this analysis was conducted, a second analysis looking only at patients who were actively on adalimumab was performed, and within this calculation, only 93 of the original 137 patients (68%) with fecal calprotectin levels remained. Tables 7a&b outlines the number of patients with fecal calprotectin and currently on adalimumab, stratified by disease specificity. Tables 8a&b outlines the level of fecal calprotectin within this same group of patients and shows that fecal calprotectin levels were notably higher (70.0% increase in combined groups) in patients with both Crohn’s disease and ulcerative colitis with BMI <25.

CRP was performed in 430 of the 507 patients (85%) in the study. Tables 9a&b outlines the total number of patients in each BMI subgroup classifications compared with total patients and specific disease. Tables 10a&b shows the same comparison groups but averages the CRP value per group. Again, CRP levels were notably higher (62.5% increase in combined groups) in patients with both Crohn’s disease and ulcerative colitis who also had a BMI <25.


ESR was performed in 431 of the 507 patients (85%) in the study. Tables 11a&b outlines the total number of patients in each BMI subgroup classifications compared with total patients and specific disease. Tables 12a&b shows the same comparison groups but averages the ESR value per group. Interestingly, unlike CRP and fecal calprotectin levels which showed large differences between groups, average ESR levels were very similar with <1% difference.


Adalimumab levels and antidrug antibodies
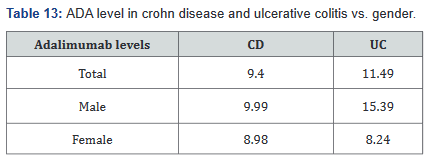
140 patients of the total 507 (28%) had adalimumab levels drawn while on receiving the drug. With this information we were able to calculate the levels within the Crohn’s disease and ulcerative colitis groups, as well as breaking it down into male and female, which is shown in Table 13. Table 14 shows adalimumab levels broken down by BMI subgroup, and illustrates a lower adalimumab level as BMI increases.


Of the 140 patients who had adalimumab levels and antidrug antibodies drawn, 39 were found to have developed antidrug antibodies. Within the Crohn’s disease group, 33 of 117(28%) were found to have antidrug antibodies, while 6 of 33(18%) of ulcerative colitis patients were found to have antidrug antibodies. Table 15 looks at antidrug antibody formation based on BMI subclass, with a p value of 0.2398 when comparing the different BMI subcategories.
Discussion
Previous studies have examined the effect of adalimumab therapy on disease state with regards to weight, 7,8 however our goal was to examine the IBD specific population, and directly compare clinical markers, endoscopic findings, and the role of therapeutic drug monitoring in different weight classes.
This study illustrates that approximately 27% of our 496 patients fall into the obese category, but if you expand the elevated BMI group to include the overweight category with the obese category, the group then includes over half of our patients (57%). It was previously published that the trend in weight amongst IBD patients follows that of the general population and therefore generally speaking, this will have implications on the medical comorbidities of IBD patients due to the obesity epidemic [17]. It should be noted as well that the median age in the study is 38, and population studies show that should weight increase, we will continue to have a population of rising weight and older age. Thus, with obesity rates increasing throughout the world, it is especially important to establish any differences in drug clearance in patients with varying BMI’s.
Interestingly, our study did not show any significant changes in endoscopic findings across different BMI categories. We recognize that retrospective evaluation of endoscopic findings is difficult but given the fact that the procedures were performed by one of two total IBD providers at MUSC, we hope this minimizes potential bias. The Mayo Clinic score is a well validated tool to assess endoscopic activity in ulcerative colitis, and there was no significant difference between mild, moderate, severe, and normal endoscopic findings when divided into the three separately examined weight classes.
We also looked at BMI compared with CRP, ESR and fecal calprotectin, but found that no clinically significant data was seen, which is of particular interest given that obesity is thought to be a state of systemic inflammation [18,19]. Fecal calprotectin is a gut specific inflammatory marker, and therefore should eliminate the role of obesity. It is postulated that this again confirms that weight had no bearing on disease status in this study.
When evaluating adalimumab levels, we can clearly follow a downtrend in the level of drug based on increasing BMI in both ulcerative colitis and Crohn’s disease. Previous data within the adalimumab population showed that weight did not play a role in efficacy, and therefore weight based dosing is not recommended. 8 Despite the lack of endoscopic and laboratory evidence of clinical significance, we still feel that long-term, this difference could account for loss of response, as well as antidrug antibody formation, and that longer-term data may be necessary to shed light on the significance of these drug levels. There is a fair possibility that over an increased time period, lower levels may lead to worsened clinical outcomes and an increased propensity for antibody formation.
This study has multiple strengths. It was conducted at an academic center with a well-established department of gastroenterology and specialists in IBD, the sample size was larger than previous studies, 8 and furthermore, endoscopic exams were available to be reviewed, which made grading disease severity possible. Data was collected in real time and updated automatically
This study does have some limitations that need to be noted. It was undertaken in a single center in a retrospective fashion, and not all patients seen at this center who were on adalimumab had serum trough levels drawn. The scoring system endoscopically for Crohn’s disease is also limited to a retrospective analysis and categorization into mild, moderate, and severe for study purposes. Finally, this study aimed to determine if there was a relationship between elevated BMI and serum adalimumab levels/endoscopic findings but did not look directly at the relationship between various serum adalimumab levels and endoscopic findings. Multivariate analysis using lower cutoffs of adalimumab levels in relation to SES-CD may have yielded more statistically significant results. The analysis was also done on multiple groups in contrast to a direct comparison of one group to another, although this could be done if necessary. Finally, not every patient within the study had the lab data collected, and certain BMI categories were underrepresented and underpowered.
Conclusion
In conclusion, in patients with IBD on adalimumab, a higher BMI is associated with a lower serum adalimumab level. The lower level of adalimumab seen in this study did not reflect any significant change in endoscopic or laboratory findings, however, longer follow up may be necessary to establish clinical correlation.
For more articles in Advanced Research in Gastroenterology & Hepatology please click on https://juniperpublishers.com/argh/index.php
For more about Juniper Publishers please click on: https://juniperpublishers.com/video-articles.php


Comments
Post a Comment