Gelatin-Agar Liver Phantom to Simulate Typical Enhancement Patterns of Hepatocellular Carcinoma for MRI
ADVANCED RESEARCH IN GASTROENTEROLOGY & HEPATOLOGY JUNIPER PUBLISHERS
Abstract
Background: Hepatocellular carcinoma (HCC) is one of the most common cause of cancer-related deaths worldwide. The objective of this study is to detect the various stages of HCC through the utilization of a dynamic liver phantom with MRI.
Methods: Three liver phantoms composed of different gelatin concentrations (2.5%wt, 4.0%wt, and 5.0%wt) and fixed agar concentrations were used. The HCC samples consisted of agarose and glycerol and were of varying sizes (0.5,1.0, and 2.0cm). The chemical, mechanical, electrical, and imaging properties of the phantoms were examined. The consistency of T1 and T2 signal intensities over a six-week period was studied. In addition, dynamic contrast-enhanced MRI was used to detect the HCC samples through the Dixon sequence.
Results: The gelatin concentration of 5%wt was the most stable in regard to density, exhibited the lowest average compressive strength of 0.22MPa, and had the lowest electrical conductivity over the course of a six-week period. During this time, an increase in the T1 signal intensity was observed as the gelatin concentration in the sample increased. On the contrary, the least change in T1 and T2 was noted in the first sample with the 2.5% wt of gelatin. The HCC samples simulated the typical appearance of HCC, with the minimum sample size the body coil could detect being 1cm.
Conclusion: Typical Enhancement patterns of HCC were simulated under MRI.
Keywords: Liver phantom; HCC; Typical enhancement patterns; Dynamic phantom
Abbreviations: HCC: Hepatocellular Carcinoma; AFP: α-Fetoprotein; CT: Computed Tomography; MRI: Magnetic Resonance Imaging; PET/CT: Positron Emission Tomography/Computed Tomography
Introduction
The most common type of primary liver cancer is hepatocellular carcinoma (HCC). It is known that early detection can render a more effective treatment; however, the majority of HCC cases are detected in later stages [1,2]. According to recent research, early detection of HCC increases treatment efficiency by 60% in comparison to treatment efficiency during later stages [3]. Several methods are used to detect HCC, such as α-fetoprotein (AFP), ultrasound, Computed Tomography (CT), Magnetic Resonance Imaging (MRI), and hybrid Positron Emission Tomography/Computed Tomography (PET/CT) [4].
Liver phantoms have been used in many medical applications such as in developing medical techniques, improving image quality, improving surgeons’ job performance, and assisting in the early detection of various diseases [5,6]. The applications of liver phantoms also include diagnostic imaging of diseases via imaging modalities including but not limited to: ultrasound, CT, and MRI. Each of the aforementioned imaging modalities requires specific phantom characteristics; specifically, each uses distinct materials in order to simulate different organs in the human body [7].
In previous studies, different materials have been used to fabricate liver phantoms for MRI such as polyacrylamide gel [8], carrageenan gel [9-11], agar gel [12,13], agarose gel [14-16], gelatin [17,18], polyurethane [19], and polyvinyl alcohol [20]. In addition, materials such as agarose-glycerol and polyurethane have been used to simulate HCC. Gelatin and agar powders have been used in previous research to simulate different body parts such as the head, neck [21,22], breast [23,24], skin [25,26], spine [27] and thyroid gland [28]. These materials can also be used to simulate the human liver [29,18]; however, previous studies did not address the idea of applying a dynamic phantom to simulate HCC.
There are several issues that need to be considered when using dynamic phantom. The phantom should be in a container that allows the transfer of contrast material from the arteries to the veins through the study samples, the substance of the sample should possess the appearance of HCC, the sample should interact with the contrast material, the sample should work to remove the contrast material without altering the sample structure, flexibility regarding changing the HCC samples without affecting the liver parenchyma structure, and the phantom should allow the pumping and disposal process of the contrast material by using an automatic injector and suction device.
Through dynamic simulation of HCC, this simulation provides many clinical trials that benefit in the ability to early detection of HCC under MRI, developing a suitable MRI sequence for HCC detection, and provide quantitative information on the contrast agent amount that needs to be given to the patient. Given this scenario, the current study aims to fabricate the human liver phantom using gelatin and agar powders. It also aims to simulate HCC in its various enhancement pattern stages through the application of a dynamic phantom under MRI.
Materials and Methods
Phantom design
Three gelatin-agar samples were prepared by using the same concentration of agar and different gelatin concentrations. The steps for preparing the phantom were similar to previous studies [14,17].
In the first sample, 2.5%wt dry weight of gelatin powder was used. The second sample had 4%wt dry weight of gelatin powder, whilst the third sample 5%wt dry weight of gelatin powder. The concentration of agar powder in all samples was fixed at 1.5%wt dry weight. 2.6 %wt of dry weight hydroxyethylcellulose (HEC) powder, 0.2%wt of benzalkonium chloride (BZK), and 3.2 %wt propanediol were also added to the mixture. BZK was used for its antibacterial properties, propanediol was used in the mixture as a solvent, and water as a volume spreader. Table 1 is a comprehensive summary of the proportion of the materials which were used to prepare the gelatin-agar mixture.
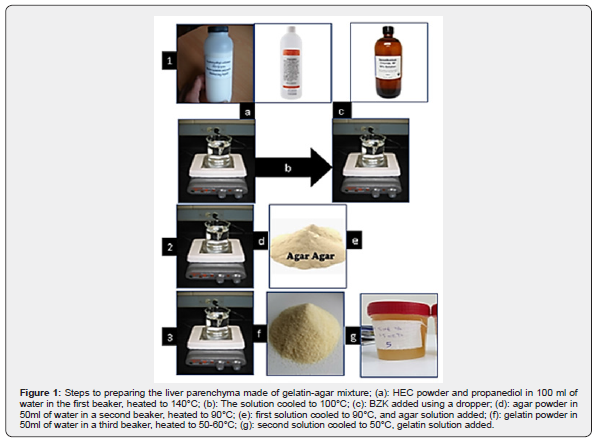

Figure 1 conveys the steps of preparing the gelatin-agar mixture. The gelatin-agar mixture was prepared by dissolving various quantities of gelatin in 50mL of water. 2.5, 4, and 5g of gelatin were used to prepare the first, second, and third sample, respectively. Additionally, a fixed amount of agar (1.5g) in 50mL of water was used. Because of the different melting points of gelatin and agar, the two solutions were prepared in separate glass containers. The temperature was monitored using a digital thermometer (HI 98501 Checktemp® Digital Thermometer).
A third glass container was prepared by dissolving 2.6grams of HEC powder and 3.2ml of propanediol in 50 ml of water. The solution was heated to 140°C and stirred using a magnetic stirrer. The solution was allowed to cool below 100°C before adding 0.2ml of BZK using a dropper. The solution was continuously stirred to prevent gravitational sedimentation of the HEC particles. The solution was then added to the agar solution, and the stirring process continued to prevent the sedimentation of the HEC.
Each container was heated at a different temperature until the gelatin and agar had dissolved in solution. The gelatin melting point reached 40-60°C, whereas the agar dissolved at 93°C. After the new mixture (agar and HEC mixture components) was cooled to a temperature of 50°C, the gelatin solution was added with a ratio of 1:1 while the solution was continuously stirred. When the mixture reached 30°C, it was poured into a plastic box container and stored at room temperature until it was used.
After the mixture was completed, it was poured into the commercial liver mold of size 23 ×18 ×13cm. The mold composed of PVC material was resistant to the temperature of the mixture. Three input tubes were connected to the cylinders where they were used to contain the HCC samples. Output tubes were connected at the end of the cylinders by using a rubber enclosure and then connected to each other to form one tube that was connected to the suction device. The rubber enclosure was used to prevent leakage of contrast agent (CA) from the samples when the direct contrast enhancement (DCE) was applied and to help the adjustment of HCC sample sizes through its movement inside the cylinders. All of the steps were described in detail in a previous study [17].
Three samples of HCC were produced. The diameter sizes of the first, second, and third sample were: 2.0cm, 1.0cm, and 0.5cm, respectively. The samples were fabricated using agarose powder mixed with glycerol and water. The percentages of agarose, glycerol, and water were: 3%wt, 9%wt, and 88%wt, respectively. The samples were produced through gently stirring agarose powder and boiling water at 50°C for 10 minutes, followed by the addition of glycerol to the mixture and stirring for another 10minutes at the same temperature. The samples were ready for use after the mixture became homogeneous and was cooled to room temperature. Lastly, the three samples were placed in the three cylinders that were inserted in the phantom.
MRI measurement
MRI scans were performed using a 1.5 T scanner (MAGNETOM Avanto, Siemens Healthcare, Erlangen, Germany). The study was conducted at the Ibn-Rushed MRI center, West Bank- Palestine. The scanner was equipped with an 8-channel phased-array coil. Axial T2-weighted images (T2WI) were obtained through the Half-Fourier acquisition single-shot turbo spin echo imaging (HASTE) sequence with the following
Parameters
Repetition time (TR): 1300 ms, echo time (TE): 91 ms, slice thickness: 6 mm, interslice gap: 0 mm, matrix: 198 x 256, and Field of View (FOV): 380 mm. Axial T1-weighted images (T1WI) were obtained using fast-low angle shot (FLASH) sequence with the following parameters: TR: 170ms, TE: 4.75ms, slice thickness: 6 mm, interslice gap: 0mm, matrix: 203 x320, FOV: 380mm, flip angle: 70°, and number of excitation (NEX): 1.
DCE was performed through Volumetric Interpolated Breath-hold Examination (VIBE- DIXON) sequence with the following parameters: TR: 6.8ms, TE: 2.39ms, slice thickness: 3mm, interslice gap: 0mm, matrix: 195 x 320, flip angle: 10°, and FOV: 380mm. These parameters were set for each of the four images obtained through the Dixon sequence, out of phase, in-phase, fat suppression, and water suppression.
A total of four images were obtained through the Dixon sequence. The first image was acquired before the administration of the Dotarem® contrast material (Guerbet, Roissy CdG Cedex, France). Afterwards, contrast material with a dose of 0.025mmol/kg of phanom weight was injected through an automatic injector (Spectris Solaris EP MR, Medrad) with a flow rate of 2mL/s. Following administration of the contrast media, the saline flush was achieved by injecting 20mL of normal saline with an injection rate equal to the flow rate. Simultaneously, images at the arterial (AP), porto-venous (PVP), and delayed phase (DP) were acquired at 25-, 70-, and 180-seconds post-injection, respectively.
Strados GUI Software was used to estimate the signal intensities of T1 and T2 relaxation times. To ensure that the estimation was inclusive of the entire phantom, three readings of the liver parenchyma from three different parts of the phantom were included. The readings were taken by setting an ellipsoidal ROI of 10 mm2 in diameter. The average of the three readings was then calculated and used to estimate the signal intensity of T1 and T2.
Variables in the study
In this study, the chemical, mechanical, electrical, and MRI properties of the liver phantom were evaluated. The chemical properties were measured using an FTIR spectrophotometer (Shimadzu IRTracer-100). The mechanical properties included density and compressive strength. The consistency of the density of the materials in the liver parenchyma was quantified over a period of six weeks. To determine any change in density, the mass was recorded at a fixed volume of 100mL, and the density–time relationship monitored. All measurements were taken at a room temperature of 25°C. The compressive strength of all samples was measured using a Compression Testing device (Instron Model 4464) over a period of six weeks. The compressive strength represents the maximum pressure strength the samples can withstand without changing their shape. The electrical properties for the phantoms were measured using SPECTANO 100, a Dielectric Material Analyzer at a frequency range of 5µHz to 5 kHz.
The MRI imaging properties were also evaluated. The variables used to evaluate the signal intensities of T1 and T2 relaxation times were: different gelatin concentrations, different TR values (its effect upon the signal intensity of T1), different TE values (its effect upon the signal intensity of T2), and acquiring the readings at different time intervals.
Results
Chemical properties of liver parenchyma materials
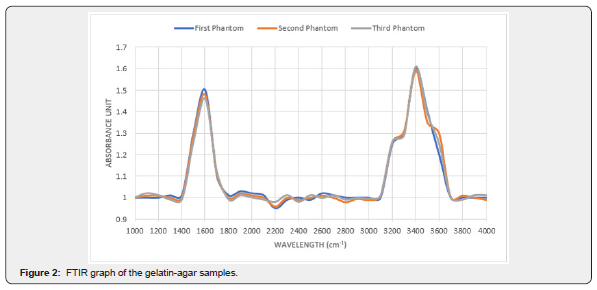
Figure 2 conveys the chemical compositions of the gelatin-agar samples. The two peaks represent the chemical bonds in the samples. The broad peak between 3200 to 3600cm-1 represents the O-H stretch bond and the narrow peak between 1500 to 1600cm-1 represents the C=O stretch bond.
Mechanical properties of liver parenchyma materials
Table 2 demonstrates the density coefficient variation (CV) of the gelatin-agar samples at different gelatin concentrations and constant agar concentrations (1.5 wt%). An agar concentration of 1.5wt% was chosen due to its close proximity in terms of density to a real human liver. Overall, gelatin-agar gel samples exhibited slight changes in density in the course of the six weeks.

The lowest density recorded was at a gelatin concentration of 2.5%wt, whereas the lowest weight and lowest strength of gelatin gel was observed. Additionally, the sample with a gelatin concentration of 2.5%wt most accurately represented the density of a human liver with a difference of 6.23% between them (Table 2). On the other hand, the highest density recorded resulted from the gelatin-agar sample with gelatin concentration of 4.0%wt. This sample, which had a density that ranged from 1.187-1.181g/cm3 exhibited the highest density difference compared to human liver (11.02%). Additionally, the sample had the least changes of density among the three concentrations with a CV of 0.20%. The consistency of density is due to the fact that the sample had the highest weight and highest strength of gelatin gel. Furthermore, the samples with gelatin concentrations of 2.5%wt and 5.0%wt showed the closest density to human liver compared to 4.0wt% (the sample with a gelatin concentration of 2.5wt% had a density that ranged from 0.915-0.978g/cm3 and a 6.23% difference compared to human liver, while the density of the sample with a gelatin concentration of 5.0%wt had a density that ranged from 1.055-1.114g/cm3 and recorded a 7.67% difference compared to human liver).

The changes in compressive strength of the gelatin-agar gel samples at different gelatin concentrations and constant agar concentration (1.5wt%) is represented in table 3. The sample with 5.0%wt gelatin concentration exhibited the highest average compressive strength of 0.54MPa and CV of 10.32%; while the sample with 2.5%wt gelatin concentration exhibited the lowest average compressive strength of 0.22MPa and CV of 6.43%. The increase in compressive strength is due to the gelatin strength and the loss of water content. In addition, a difference between the three samples in regard to their compressive strength was observed in the first week. A p-value of 0.017 was obtained (Table 3). This discrepancy due to the difference between the 2.5%wt gelatin sample and the 4.0 %wt gelatin sample, and between the 2.5%wt gelatin sample and the 5.0%wt gelatin sample where the p-value in these two samples was 0.04 and 0.000, respectively.
Electrical properties of liver parenchyma materials
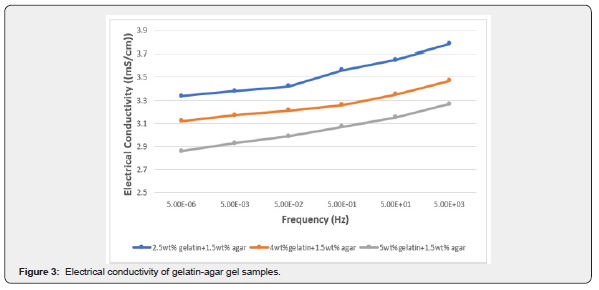
Figure 3 expresses the direct relationship between the conductivity of gelatin-agar sample and frequency, i.e., the conductivity increases with an increase in frequency. In addition, the figure shows the inverse relationship between conductivity and gelatin concentration in the presence of agar.
The effect of gelatin concentrations on relaxation times three different gelatin concentrations were used to fabricate the liver phantom while the concentrations of the remaining components were fixed. The first phantom contained a gelatin concentration of 2.5%wt, the second phantom contained 4 %wt of gelatin, and the third phantom contained 5%wt of gelatin. Table 3 shows the effect of gelatin concentrations upon the signal intensities T1 and T2. The results convey a directly proportional relationship between T1 and T2 and the gelatin powder concentrations. The T1 relaxation time changes were not significant compared with T2. This proves that gelatin can be used as a T2 modifier.
The effect of contrast media on HCC
The Vibe-Dixon T1 sequence was used to measure the signal intensity of HCC samples in the liver phantom. This sequence consists of four images: out of phase, in-phase, fat suppression, and water suppression. The fat and water components in the HCC samples can be estimated through the Vibe-Dixon T1 sequence. A total of 30 images of the phantom were obtained. An ellipsoidal ROI of 10mm2 in area diameter from the HCC sample was used as a reference to obtain the signal intensity of HCC samples. Figure 4 shows the signal intensities of the HCC samples in the four images acquired from the Dixon sequence after injecting the contrast media. All readings were taken at room temperature.
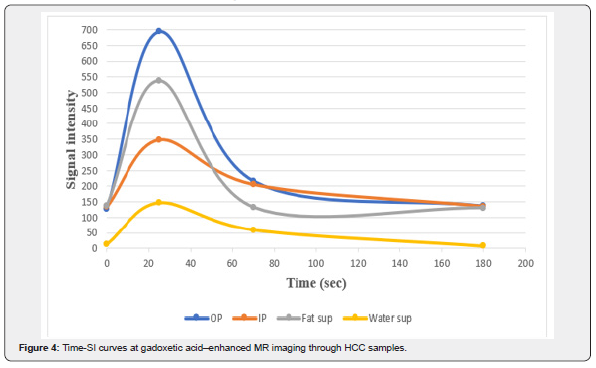
Figure 4 shows the behavior of HCC samples during contrast media injection. In the out of phase image, the signal intensity was the least in the pre-contrast phase. After injecting the CA, the signal intensity increased to its highest value (around 700) after 25seconds of CA administration (during the arterial phase). The signal intensity perpetually decreased (to approximately 220) 70 seconds after injection i.e., in the venous phase. Finally, in the delayed phase, the signal intensity reached 130 and the contrast was completely washed out of the samples after 180seconds post-injection. The expected percentage of water in the sample was very large as the signal intensity in the water suppression (fat only) image was 14. On the other hand, the signal intensity in the fat suppression (water only) image was 138. This signal intensity indicates that the HCC samples consisted of 90% water and 10% of fat-containing components in the sample (glycerol and agarose).
The fat percentage in the pre-contrast study did not change in the delayed phase; thus, the materials used to fabricate the HCC samples remained the same with a small difference of 1-2% that was observed after contrast injection. This indicates that the CA did not affect the components of the HCC sample. Figure 5 shows the images acquired at different phases through using the body coil (the first sample is 2.0cm in diameter, the second sample is 1.0cm in size, and the third sample is 0.5cm in diameter). As the figure shows, the first and second HCC samples were easily detected through the Dixon sequence; however, the third sample was not detected in any of the phases.
From Figure 5 several observations can be made: the three black dots inside the phantom represent the three cylinders containing the HCC samples and are labelled by the numbers 1,2 and 3 in Figure 5a. The dark gray color inside cylinder 1 and cylinder 2 represents the HCC samples while the third sample inside the third cylinder was not detected. Moreover, in the AP, PVP, and DP, the samples appeared hyperintense (bright white), less hyperintense (white), and black, respectively. The appearance of our samples, when interacting with contrast media, represents the typical pattern of HCC in the human body.
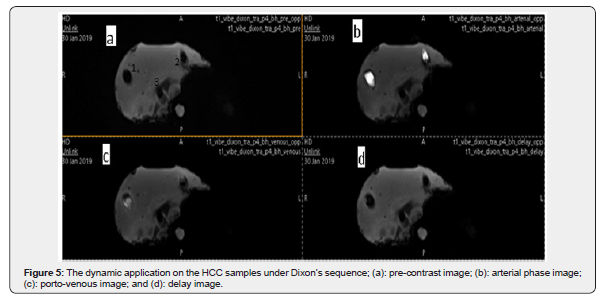
The dynamic phantom was applied to the HCC samples and during this application, the liver parenchyma remained unchanged. Due to this phenomenon, the minimal size of the HCC sample could be detected. The smallest detectable HCC sample in this study was 1cm (Table 4).

The effect of time interval on T1 and T2
The effect of acquiring the images at different time intervals upon the signal intensities of T1 and T2 relaxation times was tested. Images of the phantom were obtained once every week for six consecutive weeks. Figure 6 illustrates the temporal relationship of T1 and T2. The different combinations of gelatin, agar, and water are reflected through the relaxation times. All readings were taken at room temperature.
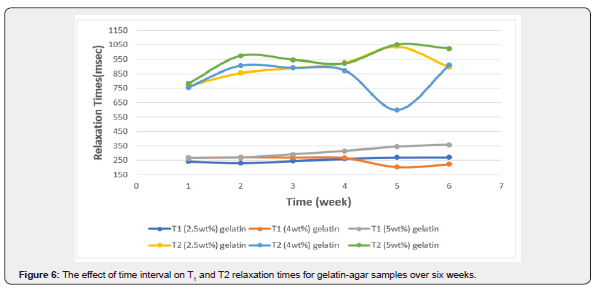
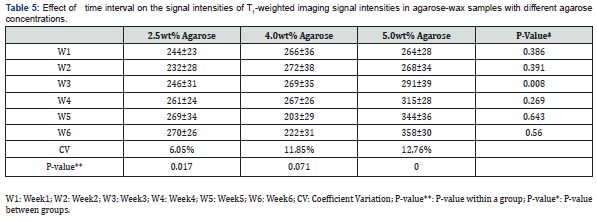
A change of 6.05% in the CV of T1 was recorded (from 232ms to 270ms) in the sample with a gelatin concentration of 2.5%wt. Additionally, a change of 11.85% (from 203ms up to 272ms) and 12.76% (from 264ms up to 358ms) in the T1 signal intensities of the samples with gelatin concentrations of 4.0%wt and 5.0%wt were recorded, respectively. Furthermore, differences in the T1-weighted image signal intensity in the gelatin concentration of 2.5%wt was recorded whereas the p-value was 0.017. Differences were observed in the gelatin concentration of 5.0%wt where the p-value was 0.000 in the course of the six weeks.
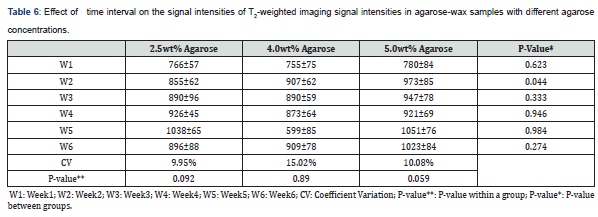
The difference in T1 was observed among the two gelatin samples with 2.5%wt and 4.0%wt (p-value: 0.049) and among the samples with gelatin concentrations of 4.0%wt and 5.0%wt (p-value: 0.014). A difference in T2 was recorded among the samples with gelatin concentrations of 2.5%wt and 4.0%wt (p-value: 0.032).
The sample with 2.5%wt gelatin concentration recorded the highest fluctuation in signal intensity during the fifth week, whereas the CV had a value of 9.95% (from 926ms to 1038ms; 10.7%). Similarly, the CV (15.02%) was maximal for the sample made up of 4.0%wt gelatin during the fifth week (from 599ms up to 909ms; 34%). Lastly, a CV of 10.08% was recorded during the second week for the sample with a gelatin concentration of 5.0 %wt indicating the highest change in signal intensity (from780ms up to 973ms; 19.8%) see table 5 & 6.
Discussion
In this study the dynamic liver phantom with HCC samples were successfully fabricated. The liver parenchyma was made of gelatin, agar, hydroxyethyl cellulose, benzalkonium chloride, and water. The HCC samples were made of agarose and glycerin. This phantom was applied based on the phantom which was fabricated in a previous study [17]. In addition, the phantom was evaluated and applied through MR Imaging. Several variables were measured to measure their effect on signal intensity in relaxation times T1 and T2. The chemical properties of the three samples were similar in regards to the IR peaks. The two peaks appeared in several previous studies of gel polymer samples [30,31]. The presence of a broad peak can be explained by the presence of water in the samples. The bandwidth of this peak increases with an increase in the water content present in the samples [32].
The change in density of the three samples over a six-week period was less than 3%. This indicates that the samples have good stability in density over time; however, changes in density of gelatin samples were less than gelatin-agar samples [14]. The small difference in density of gelatin samples compared to gelatin-agar is explained by the presence of agar. Also, agar works to increase the growth of bacteria inside the samples; therefore, the disturbance in the density of the samples is greater compared to the samples that had no agar [33]. Due to this, the changes in the density in gelatin-agar samples is more pronounced in comparison to samples exclusively made up of gelatin. However, the addition of agar in the samples reduced the sample’s density close to human liver density. This is due to the density of agar, which is 0.81g/cm3 (which is lower than the density of gelatin typically 1.2-1.4g/cm3).
The decrease in compressive strength with increasing gelatin content is indicated by enhanced agar interaction in the gelatin-agar samples. The compressive strength continuously changes over time in the samples with 2.5%wt and 4.0%wt of gelatin compared with the sample with 5.0%wt of gelatin. The fluctuation of the compressive strength is due to the large amount of water content. Although the samples were tightly covered in the plastic container, the continuous evaporation of water occurred; therefore, the sample rigidity changed over time [31]. This behaviour was very similar to the carrageenan-agar samples in a previous study [31], where similar changes were observed.
The conductivity of human body tissues is measured at a frequency ranging from 915MHz to 2.45GHz [34]. This frequency exceeds the range of the device utilized in our study; however, the results show that the conductivity increases with increasing frequency. An inversely proportional relationship between conductivity and gelatin concentration in the presence of agar was observed [21]. This relationship indicates that agar acts as an isolator in the three samples due to decreased mobility of charge carriers. This is confirmed by a study conducted by Cho et. al. [35] where an inverse relationship between the conductivity and the presence of agar in the study samples exists.
Due to the low water content, a direct relationship between the gelatin concentration and the T1 signal intensity was indicated. Contrarily, fluctuating values in T2 were recorded due to the presence of agar, which acts as a modifier; moreover, the recorded changes are due to the aggregation originating from agar within the samples [36-42]. The study also demonstrates the pattern of HCC samples within the phantom. The results show that the pattern represented the typical pattern of HCC, which is consistent with previous studies [43-46]. The MRI scanner was able to detect the stage of HCC through the size of the samples, whereas a 2.0cm sample that represented the advanced stage was easily detected using the body coil. Second stage HCC, represented by a 1.0cm sample, was detected as well. On the other hand, MRI failed to detect early-stage HCC which was represented by the sample that was 0.5cm in size [3].
Overall, insignificant differences between T1 and T2 values of gelatin-agar samples were demonstrated over a period of 6 weeks. This is due to the fact that agar determines the process of water evaporation in the three samples [47,48]. The most significant difference between the relaxation times was recorded in the fifth week. A difference in T1 and T2 relaxation times is due to the growth of bacteria that occurred in the fifth week; thus, further deteriorating the sample components [49].
Conclusion
In summary, the design of a dynamic liver phantom was successfully applied. The phantom containing various HCC samples simulating the liver parenchyma without affecting the parenchyma itself. In addition, the HCC stages were successfully simulated. The effect of the following variables upon T1 and T2 relaxation times, were studied: gelatin concentration, various values of TR and TE, and time interval. It is recommended that in further studies a T2 modifier other than agar should be used in order to further reduce the T2 relaxation time to achieve a more accurate simulation of the human liver.
For more articles in Advanced Research in Gastroenterology & Hepatology please click on https://juniperpublishers.com/argh/index.php
For more about Juniper Publishers please click on: https://juniperpublishers.com/video-articles.php


Comments
Post a Comment